Live Tornado Map — warnings, watches & storm tracker
Everything on the map is clickable: warning and watch polygons open a detail card (area, expiry, what to do), the shaded outlook zones explain their risk level, and each reported tornado links straight to a NASA satellite view of that spot. The map checks for new alerts every 3 minutes while open. Quiet map = good news.
Active alerts
Watch vs. warning — the difference that matters
🟧 Tornado WATCH
Conditions are favorable for tornadoes over a broad area in the coming hours. Nothing has been sighted yet. Keep an eye on the sky and on this map, know where you would shelter, charge your phone.
🟥 Tornado WARNING
A tornado has been sighted or indicated by radar inside the red polygon. Take shelter now: lowest floor, interior room, away from windows. Mobile homes are not safe — move to a sturdy building.
Reported tornadoes — today and yesterday
| Time (UTC) | Location | County | State | Notes |
|---|---|---|---|---|
| Loading reports… | ||||
Preliminary local storm reports from the NOAA Storm Prediction Center — surveyed ratings (EF-scale) come days later.
Tornado season and Tornado Alley
The United States sees about 1,200 tornadoes a year — more than anywhere else on Earth, because flat terrain lets dry Rocky-Mountain air collide with warm, moist Gulf air. The classic Tornado Alley runs from Texas through Oklahoma and Kansas into Nebraska; Dixie Alley (Mississippi, Alabama, Tennessee) is infamous for fast, rain-wrapped, night-time tornadoes.
Peak season is April–June, when the strongest outbreaks occur; a secondary peak hits in November. But tornadoes have struck every state and every month of the year — which is exactly why a live map beats a calendar.
Tornado damage, seen from space
A violent tornado leaves a mark that satellites can see: a pale scar of stripped trees and scoured fields, sometimes running for tens of miles in a nearly straight line. That's why every reported tornado on our map carries a 🛰 satellite link — it opens NASA's Worldview at that exact spot, on the day of the report. Fresh imagery lands within 1–3 days (Landsat/Sentinel pass schedule), so check back: weak tornadoes over open ground rarely leave a visible trace, but EF3+ tracks through forest are unmistakable.
More live maps from our team
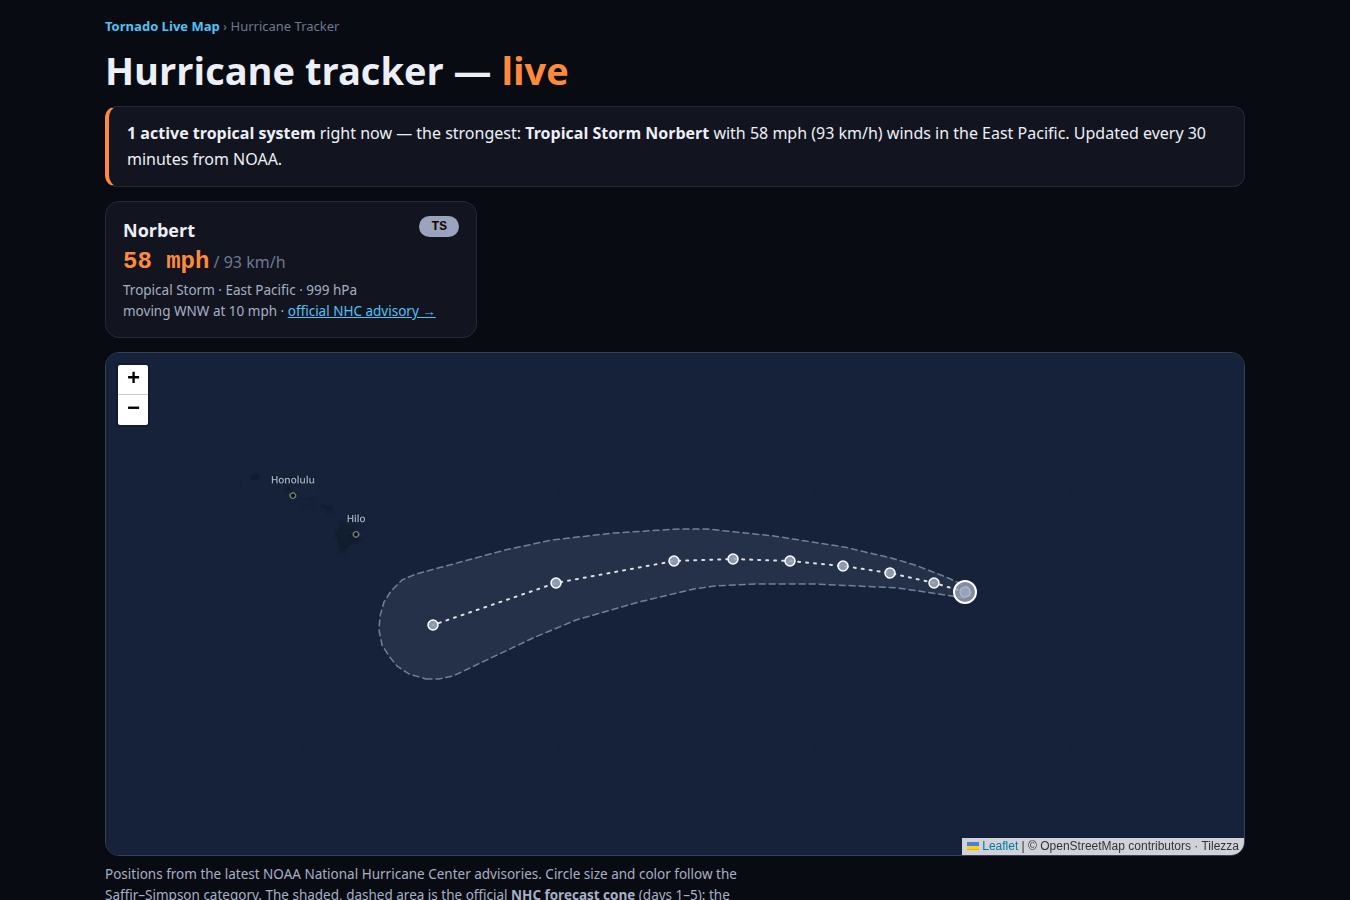
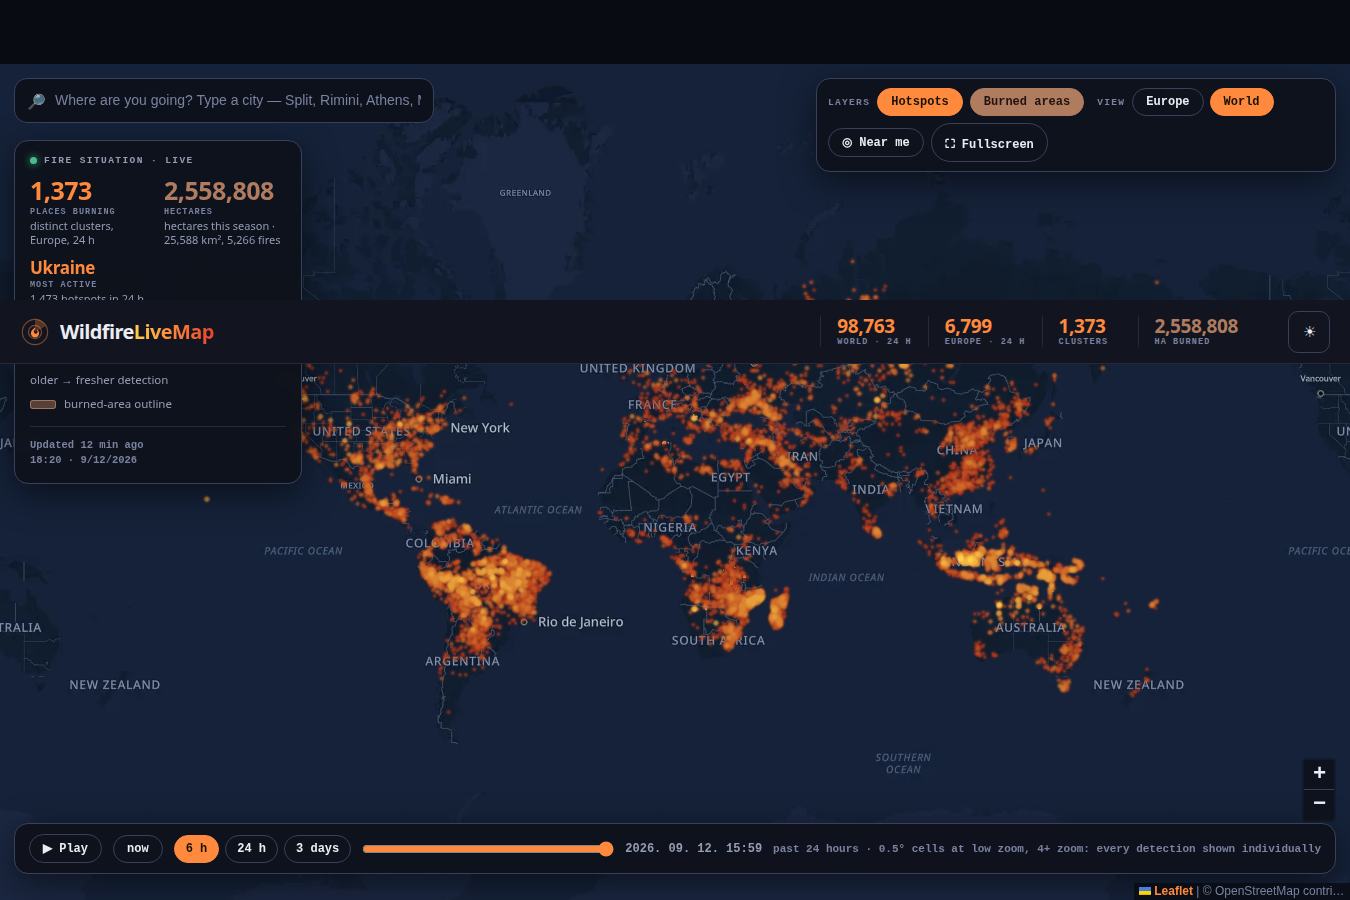
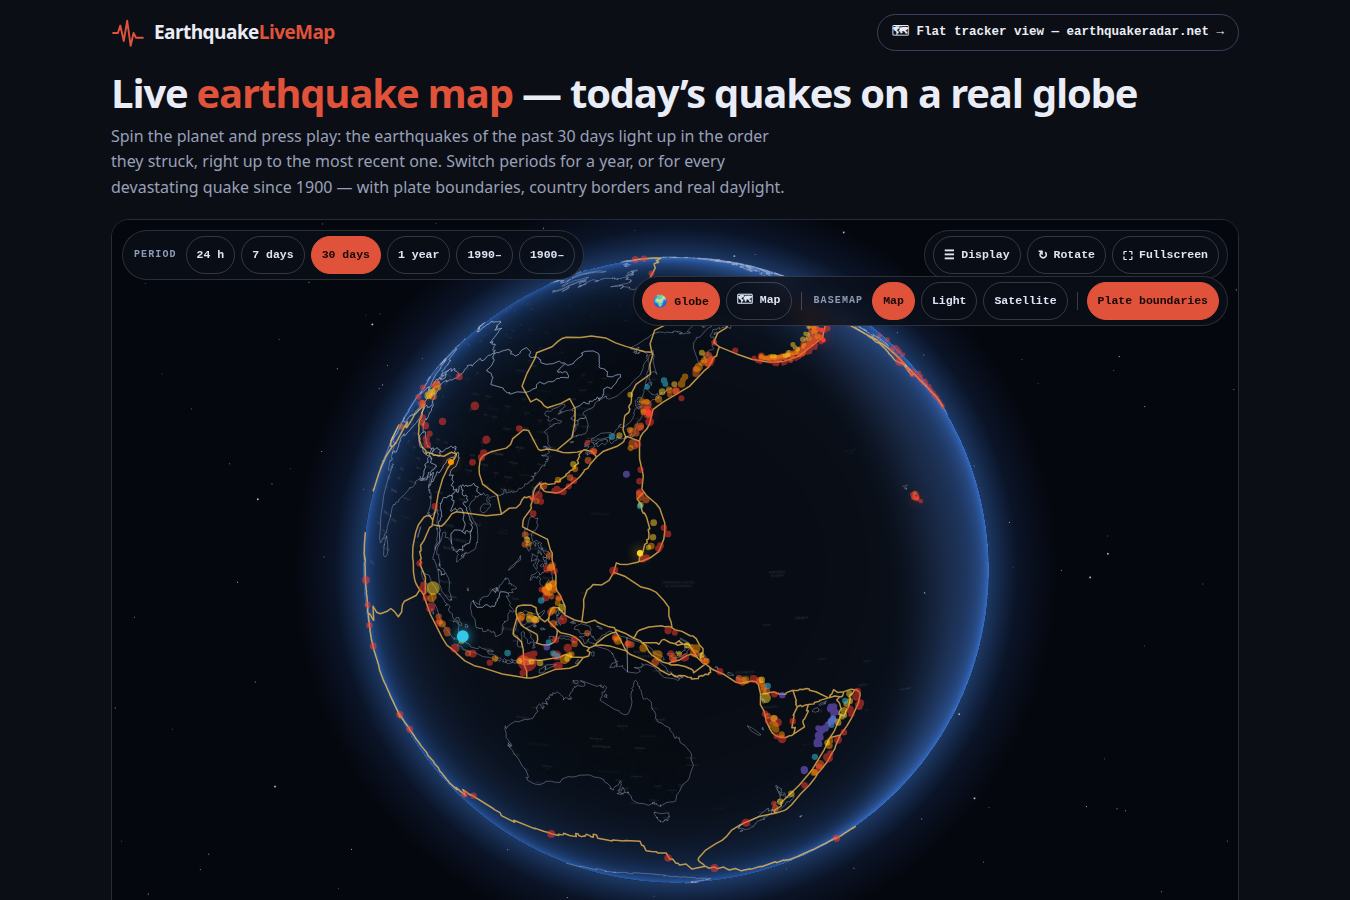
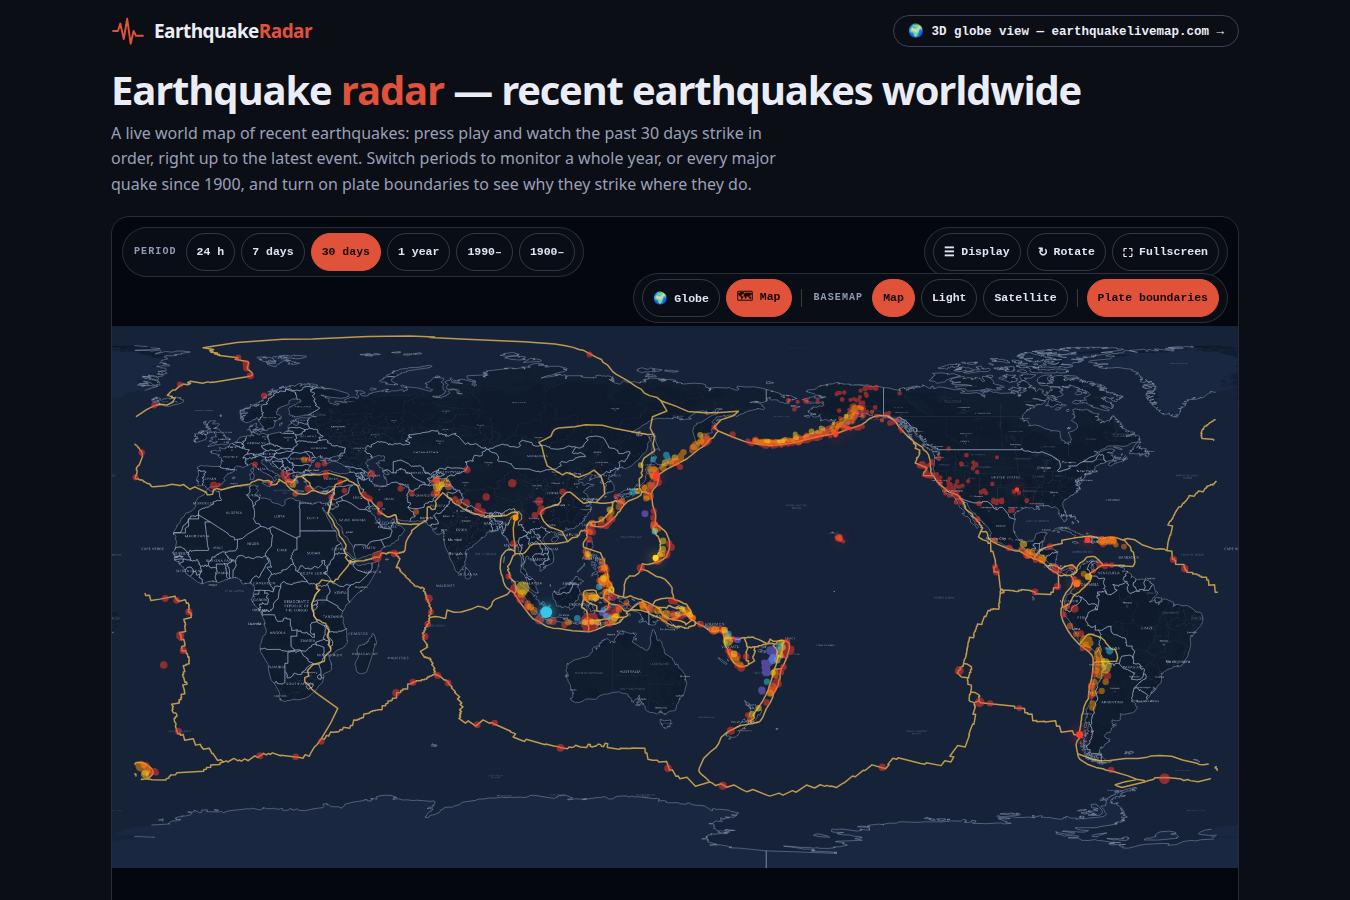
We build live, data-driven maps — one honest page per hazard, straight from official sources. If this one is useful, you may like the others:
About us
TornadoLiveMap is built by Digital Dynamics, a small European team that runs a family of live-data maps — wildfires, earthquakes, hurricanes, floods — all on the same principles: official sources only, no sign-up, no clutter, and honest labels about what the data can and cannot tell you. The maps run on our own EU-hosted tile service, so no visitor data ever leaves our servers.
Frequently asked questions
Is this map official?
The data is 100% official — NWS warnings, SPC reports and
outlooks — displayed unmodified. For emergency decisions always follow local authorities and
NOAA Weather Radio.
Does the map cover places outside the US?
Live warning polygons exist only for
the United States (no other country publishes them openly in real time). Reported tornadoes
and the outlook are also US products.
What does the shaded outlook mean?
The Storm Prediction Center's Day-1 outlook:
the darker the shading, the higher the chance of severe storms — from light green (general
thunderstorms) up to magenta (HIGH risk, likely outbreak).